Campaign Manager - Campaign Manager (Silverlight)
Running and analyzing Historical PerformanceOpen the Historical Performance tool by dragging it from the toolbox into the document toolbar. Procedure
Recency In the Transaction field, select a column that will provide the Recency value (usually a transaction date on the Order table). Select a time period to analyze. By default the Report Through field will populate with the latest date in the selected date column. This can be amended as appropriate. For example, a period of 'Months x 12' through to 04/04/2011 will analyze the twelve months before 04/04/2011. Frequency Select a table that will be used by the tool to calculate how many times a customer has purchased. This will usually be the Customer table if you are looking at customer transactions. The tool will use Engine Links to validate the selection. The selected Depth will specify how many records to select, and from which end of the results that is lowest, highest, or banded. Measures (Cells) By default a Count of Customer measure will be used as the basis of the resulting report. This can be edited to display another measure, for example Total Order Value. Filter Use the filter to provide the segment of people that you wish to analyze. If no filter is applied then the calculation will be performed on all records in the table specified by the Frequency > Count field.
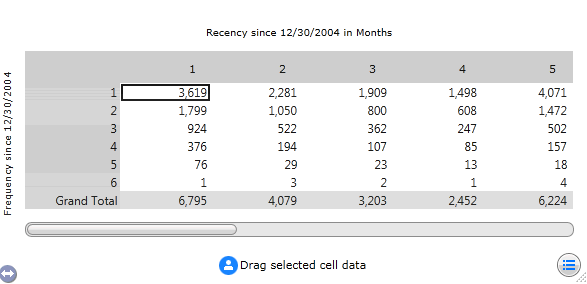
Analysis of this report indicates the most valuable customers and those you might want to target in specific campaigns. For example, in the grid above, the grand total of column '1' is 6,795. This indicates that the most recent order of 6,795 customers was placed within 1 month of the specified ' Report Through' date. Within this column you can see that one customer has placed at least 6 orders in the 12 month period, whereas 3,619 customers placed their first order in month 1. The customers with the highest order frequency in month 1 could be described as 'best' as they are recent customers that have placed many orders. The grand total of column '5' is 6,224 indicating that this many customers placed their latest order in month 5. In this group, 4 customers have an order frequency of 6 which indicates that they have placed at least six orders between months 5 and 12. Cells in later months containing large customer counts with high associated order frequencies highlight segments that might require further analysis. For example, you might want to investigate the reasons why the customers in those groups have not placed more recent orders. You could also identify the future campaigns that these customers could be targeted in, and so on. |
| Online & Instructor-Led Courses | Training Videos | Webinar Recordings | ||

|
© Alterian. All Rights Reserved. | Privacy Policy | Legal Notice |   |